PPF Curves – Production Possibility Frontiers (AS/A LEVELS/IB/IAL)
PPF Curves – Production Possibility Frontiers (AS/A LEVELS/IB/IAL)
Level: AS Levels, A Level, GCSE – Exam Boards: Edexcel, AQA, OCR, WJEC, IB, Eduqas – Economics Revision Notes
PPF Curves – Production Possibility Frontiers
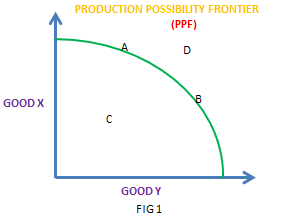
A production possibility frontier (PPF) shows the maximum potential output of two goods or services that can be produced when all resources are fully employed.
Exam Tip: The PPF curve can be used to highlight the concept of opportunity cost, scarcity and economic growth in your exam.
What does point A and B show?
- Production at any of these two points shows that all resources are fully employed. This theoretically means that everyone is working and all resources are used to their maximum. Therefore with the current amount of resources, no more output can be produced.
What point C shows?
- This highlights spare capacity in the economy. This point shows that resources are not used efficiently.
- If a country increased one of its factors of production then it would be able to move towards points A and B.
For E.g. increasing the efficiency of technology could help it to move towards its full potential to points A and B.
What point D shows?
- This point is currently unattainable with the current resources available.
How to show opportunity cost using a PPF curve?
Opportunity cost refers to the value (cost) of the next best alternative forgone (given up).
Opportunity cost is to do with making choices. Government, producers and consumers all face choices.
- E.g. A consumer could be faced with the choice of spending £10 on buying some food or buying a revision book for economics.
- If the student chooses to buy some food he is unable to buy an economics revision
- However if the consumer chooses to buy the revision book he will have to forego (give up) buying some food.
- Let us assume the economy is currently producing at point A where it is producing 90 units of Good Y (PS4) and 60 units of Good X (XBOX) with all its resources fully employed.
- If the economy now wants to produce more of Good X it would have to forgo (90-40 = 50) units of Good Y. This would enable them to gain an extra (95-60 = 35) unit of Good Y and move from point A to B.
- Therefore the opportunity cost of moving from point A to B is forgoing (giving up) 50 units of good X to gain 35 units of good Y.
Shifts in the Production possibility frontier
- A country can increase its production potential through an increase in the efficiency, quantity or quality of its resources. For example, a country could invest in new technology which would help to make the production process more efficient.
- It’s also possible for the PPF curve to shift inwards highlighting a decrease in the productive potential of a country. This could happen due to catastrophes such as flooding destroying agricultural farmland.
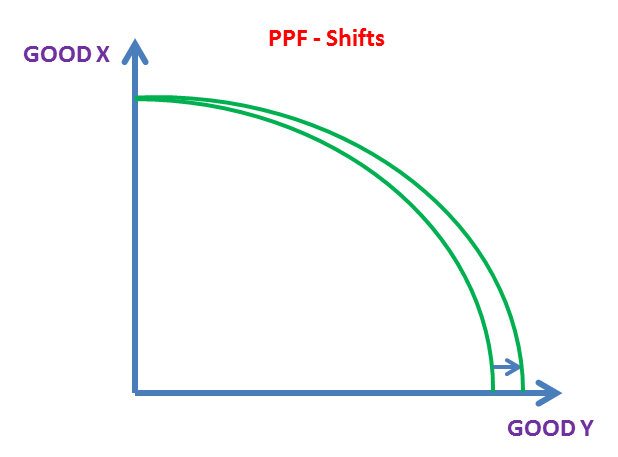
- The PPF curve shifting to the right for both goods can also be described as economic growth shown below.
- The PPF curve could also only shift outwards for one good. If the technology only improves for good Y then there will only be a shift outwards along good Y’s axis shown below.
Distinction between Capital Goods and Consumer Goods
- Capital Goods – physical assets which a company uses and are converted into finished goods at the end of the production process
- Consumer Goods – these are items bought by consumers and fall into three categories: durable goods. nondurable goods and services
Additional Content – AQA Spec
Productive and Allocative Efficiency
Resources are being used to their productive potential, making all points on the boundary are productively efficient
Since increasing the capacity of one good cannot be done without reducing the quantity of another good, not all points on the boundary can be allocatively efficient
Pareto Efficiency – no one can be made better off without worsening the circumstance of another
If more of both goods can be produced, there will be an improvement in welfare and a gain in allocative efficiency
Allocative efficiency is concerned with how goods / services are distributed and the PPF curve only shows potential output
Quick Fire Quiz – Knowledge Check
- Define Production Possibility Frontier (PPF) (2 Marks)
- Draw a diagram showing a PPF curve for capital and consumer goods (2 Marks)
- Define capital goods (2 Marks)
- Show opportunity cost on your PPF curve using numbers (4 Marks)
- Show the following points on your PPF curve
a. A point showing an inefficient allocation of resources (1 Mark)
b. A point that is unattainable with the current resources (1 Mark)
c. A point showing that all resources are fully and efficiently produced at maximum capacity (1 Mark) - Draw a shift in the PPF curve due to an increase in labour productivity for both goods (2 Marks)
- Draw a shift in the PPF curve if there is an increase in technology efficiency just for capital goods (2 Marks)
- Explain the difference between a Capital Good and a Consumer Good (4 marks)
Next Revision Topics:
- Opportunity Cost
- Factors of Production
- Economic Growth – causes / benefits / costs
- Measuring Economic Growth
A Level Economics Past Papers


