Equilibrium Levels of Real National Output
Equilibrium Levels of Real National Output
Level: AS Levels, A Level, GCSE – Exam Boards: Edexcel, AQA, OCR, WJEC, IB, Eduqas – Economics Revision Notes
Equilibrium – a balancing point where aggregate demand equals aggregate supply, dictating the price level and real GDP of a country
Equilibrium on an AD / AS diagram
- At equilibrium, there is no tendency to change the price level or output as aggregate demand and aggregate supply equal each other
- If price level was higher than equilibrium (PLe), aggregate supply would exceed aggregate demand and there would be a tendency for price level to then fall to compensate for the unsold goods / services
- If price level was lower than equilibrium, aggregate demand would be greater than aggregate supply as more consumers would be purchasing products for a cheaper price. Hence, price level would have to rise to compensate for the shortage of goods / services
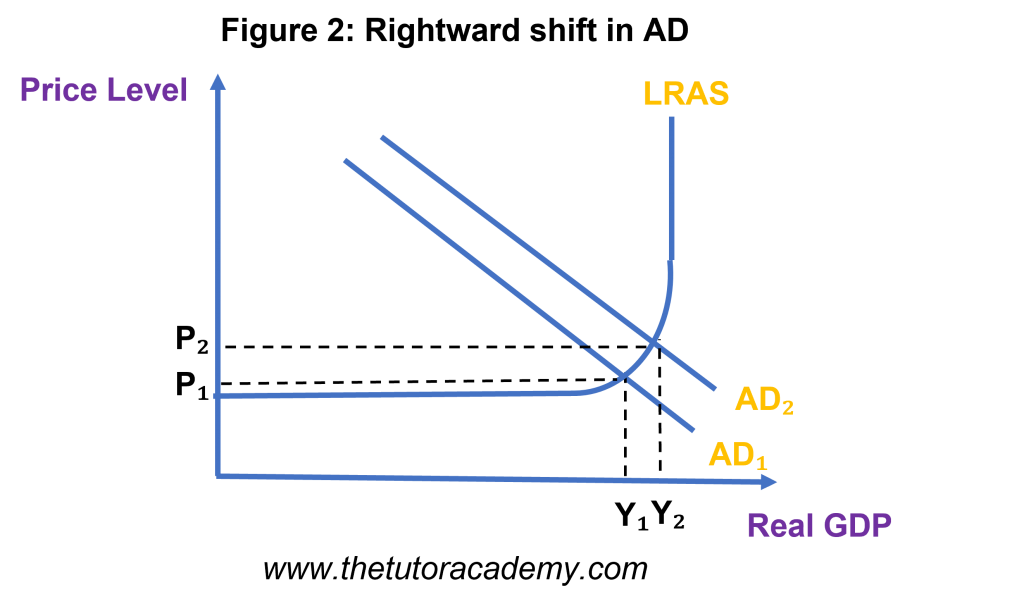
Rightward shift in AD
- Consumers are purchasing more goods, leading to an increase in aggregate demand.
- As a result, price level also rises from PL1 to PL2, causing inflation, employment and economic growth, shown by an increase in the Real GDP.
- A new equilibrium is established at PL2,Y2
- AS Curve: these effects are true for when the AS Curve is upward sloping. There will be a greater effect on economic growth instead of price level if the AS is more elastic. However, if the AS is perfectly inelastic, an increase in aggregate demand will solely affect price level.
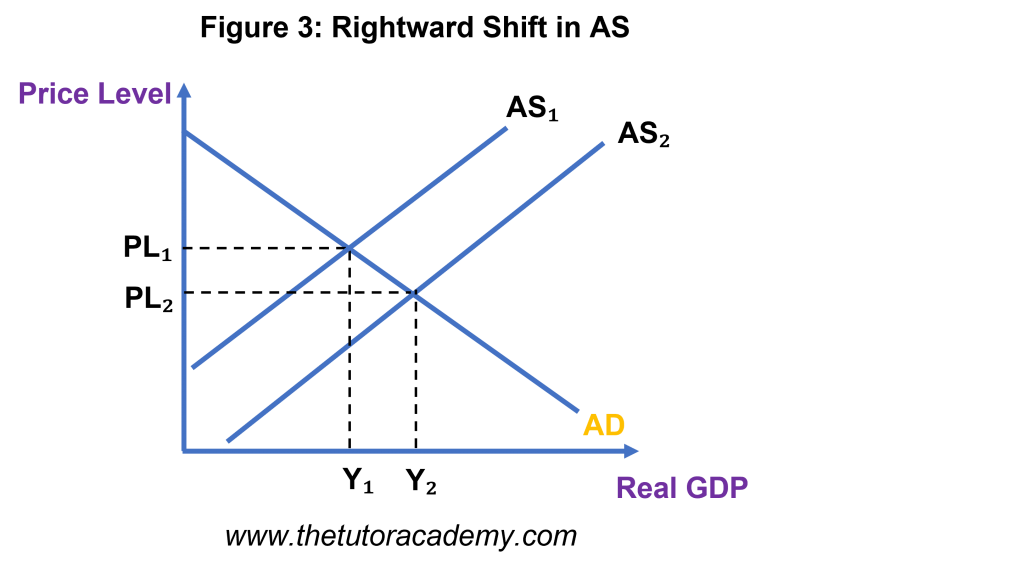
Rightward shift in AS
- An increase in aggregate supply will cause a rightward shift in the AS curve
- Consequently, price level will fall, resulting in deflation
- However, there will be an increase in economic growth, shown by a greater Real GDP value
- This effect is dependent on AD crossing AS, where AS should not be perfectly elastic
- There will be no effect on price level or output, simply just an increase in the output gap if AS is perfectly elastic
Quick Fire Questions
1. Define ‘Equilibrium’ (2 marks)
2. Using a diagram, explain what the equilibrium point shows and what would happen if price level was higher / lower (6 marks)
3. Using a diagram, explain the effect of a rightward shift in AD (6 marks)
4. Identify and explain the conditions of AS for which the effects of a rightward shift in AD would be true (4 marks)
5. Using a diagram, explain the effect of a rightward shift in AS (6 marks)
6. Identify and explain the condition of AD for which the effects of a rightward shift in AS would be true (2 marks)
7. Explain the effect caused when AS is perfectly elastic (2 marks)
Next Revision Topics
- Economic Growth
- Aggregate Demand
- Aggregate Supply
- Exports / Imports
- The Multiplier
- Circular Flow of Income
- Gross National Income
- Output Gaps
- Trade Cycle
A Level Economics Past Papers


