Data Handling – Pie Charts
Data Handling – Pie Charts
Courses Info
Pie Chart
. Pie charts compare data in proportions of a whole
. All segments of the chart form an angle of 360° or total population
. To work out the fraction of a segment use the formula:
angle of segment360°or frequency of segmenttotal population
Example:
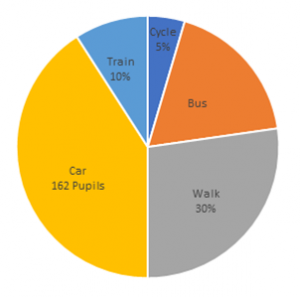
360 pupils were asked how they go to school.
Q)
1. What method is most popular?
2. What is the angle represented by the ‘walk’ segment
3. How many pupils take the bus?
A)
- The ‘car’ segment is the biggest, therefore it is most popular
- 360 pupils = 100%. 30% of pupils walk so the proportion of pupils who walk to total pupils = 30 / 100 = 3 / 10 = 360 x (3 / 10) = 108
- Find the percentage of pupils who take car 162 / 360 = 45%.
Percentage of pupils who take bus = 100 – (5 + 10 + 30 + 45) = 10% = 10 / 100 = 1 / 10 proportion of pupils who take the bus to total number of students. 360 x (1 / 10) = 36

